
Seven Tableau Mistakes That Kill Dashboard Performance
- Bernard Kilonzo

- Nov 15, 2025
- 4 min read
Updated: Jan 17

What is Dashboard Performance?
Dashboard performance refers to how quickly and efficiently a dashboard loads, processes data, and responds to user interactions like filtering, drilling down, or switching views. It’s a measure of both technical speed and user experience quality.
Key aspects of dashboard performance.
Load Time: How long it takes for the dashboard to fully render after opening.
Query Execution: Speed at which data queries are processed and returned.
Interactivity: Responsiveness when users apply filters, slicers, or drill-down actions.
Rendering Speed: Time taken to visually display charts, tables, and visuals.
Refresh Efficiency: How quickly the dashboard updates with new or refreshed data.
Here are 7 key culprits that slow down Tableau dashboards - and how to fix them
1. Live Connections to Large Data Sources
Live connections to large data sources can slow down Tableau dashboards because every user interaction - like filtering, sorting, or switching tabs - triggers real-time queries directly against the source system. This bypasses Tableau’s caching and extract optimization, leading to longer wait times, especially if the underlying database is slow, poorly indexed, or handling concurrent workloads. The latency compounds with complex joins, high data volume, and network delays, resulting in sluggish performance and reduced dashboard responsiveness.
Solution: Use Extracts instead of live connections. They’re faster and support scheduled refreshes.
2. Complex or Inefficient Calculations
Complex or inefficient calculations in Tableau - such as deeply nested IF statements, excessive use of table calculations, or poorly optimized LOD expressions - can significantly slow down dashboard performance by increasing the computational load on the data engine. These calculations often force Tableau to process more data than necessary, bypass indexing, or execute queries at a granular level that hinders caching and parallelization. When combined with large datasets or multiple filters, they can delay rendering, reduce interactivity, and strain server resources, ultimately degrading the user experience.
Solution: Pre-calculate in your database or use FIXED LOD expressions for better performance.
3. Too Many Visualizations in One Dashboard
Having too many visualizations in a single Tableau dashboard can degrade performance by increasing the number of queries Tableau must execute simultaneously, especially if each viz connects to different data sources or uses complex filters and calculations. This overloads the rendering engine, consumes more memory, and slows down interactivity as Tableau waits for all visual elements to load and respond. Additionally, excessive visualizations hinder caching efficiency and can overwhelm users, making the dashboard less intuitive and more resource-intensive.
Solution: Limit to 4–5 key visualizations per dashboard. Use navigation buttons to split content across tabs.
4. Bloated or Unfiltered Data
Bloated or unfiltered data slows down Tableau dashboards by increasing the volume of data that must be loaded, processed, and rendered during each interaction. When dashboards pull in entire datasets without applying filters, aggregations, or extracts, Tableau must scan and compute across unnecessary rows and columns, leading to longer query times and heavier memory usage. This not only hampers performance but also reduces responsiveness, especially when dealing with large datasets or live connections, making the user experience sluggish and inefficient.
Solution: Filter at the source, aggregate data before import, and remove unused fields.
5. Overuse of Quick Filters and Parameters
Overusing quick filters and parameters in Tableau dashboards can slow performance by triggering multiple queries and recalculations every time a user interacts with them. Each filter or parameter adds complexity to the data pipeline, especially when applied across multiple sheets or tied to high-cardinality fields. This increases the load on Tableau’s engine, reduces caching efficiency, and can cause delays in rendering visualizations, particularly when filters are set to “All Values in Database” or involve dynamic calculations. The result is a sluggish, less responsive dashboard experience.
Solution: Use context filters, dashboard actions, or parameter controls to reduce query load.
6. Poor Layout and Rendering Choices
Poor layout and rendering choices in Tableau dashboards - such as excessive use of floating elements, overlapping containers, or complex nested layouts - can strain the rendering engine and slow performance. These design inefficiencies force Tableau to compute pixel positions and redraw elements more frequently, especially during interactions or resizing. Additionally, using high-resolution images, transparent layers, or custom fonts can increase load times and memory usage. A cluttered layout also reduces usability, making dashboards harder to navigate and less responsive.
Solution: Use tiled layouts, avoid excessive nesting, and test layout responsiveness.
7. Ignoring Performance Tools
Ignoring Tableau’s built-in performance tools - like the Performance Recorder, Data Engine logs, and Workbook Optimizer - can lead to dashboards that remain sluggish and inefficient because developers miss critical insights into bottlenecks and optimization opportunities. Without these diagnostics, issues like slow queries, excessive data loads, or inefficient calculations go undetected, compounding delays and reducing responsiveness. Leveraging these tools is essential for identifying and resolving performance issues proactively, ensuring dashboards are fast, scalable, and user-friendly.
Solution: Use Tableau’s Performance Recorder and Workbook Optimizer to identify bottlenecks and get actionable recommendations.
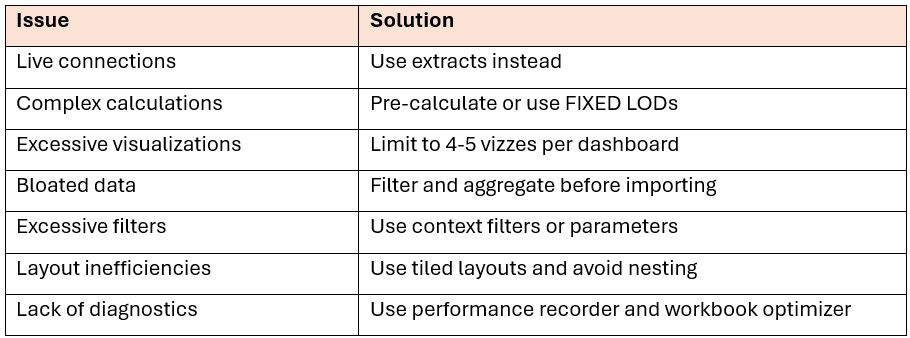
Dashboard Optimization in Summary
Conclusion
Dashboard performance isn’t just a technical concern - it’s a strategic one. A slow, clunky Tableau dashboard can erode user trust, stall decision-making, and undermine the very insights it’s meant to deliver. By avoiding these seven common mistakes - from bloated data sources to inefficient layouts - you’re not just optimizing load times; you’re elevating the entire analytics experience.
Whether you're building dashboards for executives, field teams, or public audiences, performance is the silent differentiator between adoption and abandonment. So, audit your dashboards, streamline your design, and let speed become your competitive edge.
If you like the work we do and would like to work with us, drop us an email on our contacts page and we’ll reach out!
Thank you for reading!!