Pivoting Data in Tableau
- Bernard Kilonzo

- Apr 20, 2021
- 2 min read
Updated: Jan 4, 2025

Definition
Pivoting data is the technique of data shaping that rotates data from a state of rows to a state of columns. Simply put as the process of converting data from crosstab format (which can be difficulty to work with) to columnar format.
Pivoting data is most suitable when dealing with multiple response questions (same data existing in separate fields) or crosstab data.
Example of pivoted data

There are two ways to pivot data in Tableau.
You can use Tableau Desktop (the primary tool for authoring dashboards) to pivot your data before analysis.
You can use Tableau Prep (the product suite designed for data preparations) to pivot the data prior to loading it in the Tableau Desktop for analysis.
Pivoting data with Tableau Desktop
Once you’ve connected your data, on the data source page.
Select the data fields you would like to pivot.
On the drop-down menu of one of the fields select pivot.

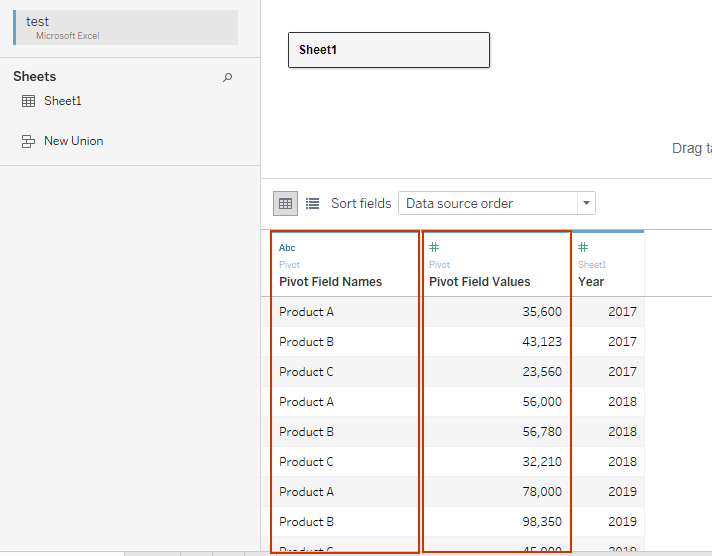
Executing this, we’ve a view with products packed on one column and values on another column.

Pivoting data with Tableau Prep
Once you’ve loaded your data in Tableau Prep.
Add a pivot step.
Drag the fields to be pivoted to the area marked ‘drop fields here to pivot them’.
Add an output step.
Export the pivoted data for use in Tableau Desktop as either Tableau Data Extract (.hyper) file or as a CSV file.

See the preview of the exported data.

We can say, the output generated in Tableau Prep is identical in every detail to the output generated in Tableau Desktop.
Conclusion
Pivoting data is a simple technique to implement in Tableau yet powerful in simplifying analysis when dealing with multiple response questions or crosstab data. I hope this article was helpful to you. To receive more of the Tableau tips and tricks, kindly join our mailing list by subscribing below.
Thank you for reading.
