
Mastering Waffle Charts in R: A Visual Guide to Proportions
- Bernard Kilonzo

- Jul 19, 2025
- 2 min read
Updated: Aug 18, 2025

Overview
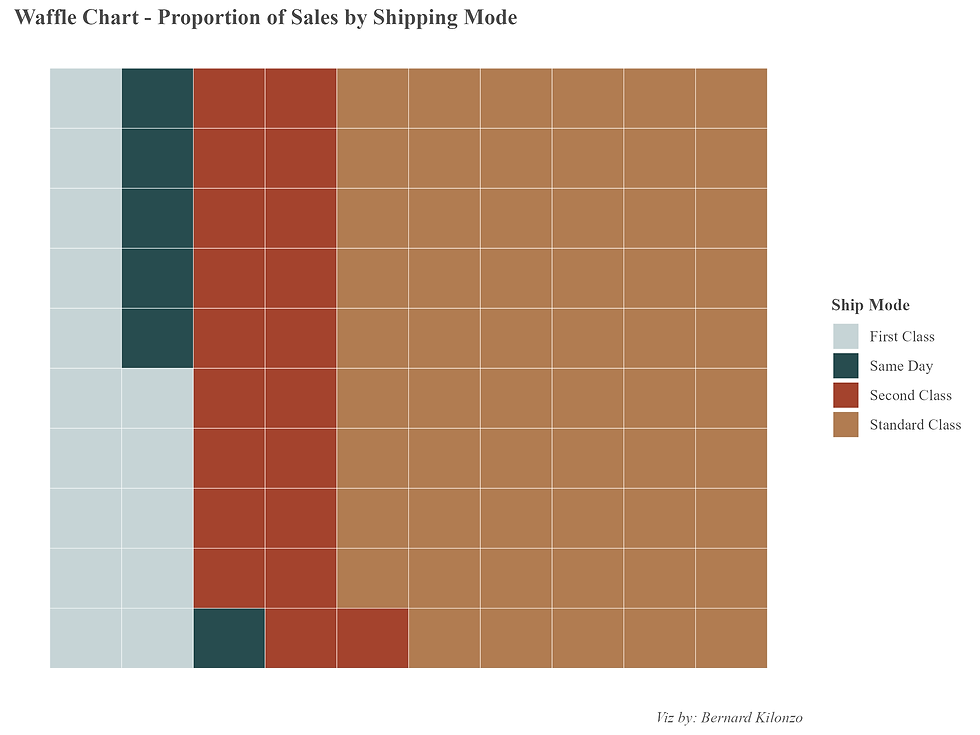
A waffle chart is a grid-based visualization used to represent proportions or percentages in a visually intuitive way. It typically consists of a 10×10 grid of squares, where each square represents 1% of a whole.
Example of a Waffle Chart
Step-by-Step Guide
Load the required packages.
# load libraries

library(tidyverse)
library(waffle)
library(paletteer)
Load data set.
# load data

superstore<-read.csv("https://raw.githubusercontent.com/bernardkilonzo-rigor/dataviz/main/data/Sample%20-%20Superstore.csv")
Computing sales proportion by shipping mode.
# computing sales proportions by shipping mode

sales_prop<-superstore%>%group_by(Ship.Mode)%>%
summarise(sales = sum(Sales))%>%
mutate(proprtion = sales/sum(sales))%>%
mutate(percnt = round(proprtion*100,0))
See the resulting table.

Creating a waffle chart to visualize proportion of sales by shipping mode.
# creating waffle chart

sales_prop%>%ggplot(aes(fill =Ship.Mode, values =percnt))+
geom_waffle(n_rows = 10, color ="white")+
scale_fill_paletteer_d("rockthemes::electric")
See the resulting view.

Formatting and customizing the waffle chart.
# creating and formatting the waffle chart

sales_prop%>%ggplot(aes(fill =Ship.Mode, values =percnt))+
geom_waffle(n_rows = 10, color ="white")+
scale_fill_paletteer_d("rockthemes::electric")+
labs(title = "Waffle Chart - Proportion of Sales by Shipping Mode",
caption = "Viz by: Bernard Kilonzo", fill ="Ship Mode")+
theme(panel.background = element_blank(),
axis.text = element_blank(),
axis.ticks = element_blank(),
plot.title = element_text(family = "serif", face = "bold", size = 13, color = "gray30"),
plot.caption = element_text(family = "serif", face = "italic",size = 9, color = "gray35"),
legend.title = element_text(family = "serif",face = "bold", size = 10, color = "gray30"),
legend.text = element_text(family = "serif", size = 9, color = "gray30"))
See the resulting view.

Replicate the viz: Link to codeConclusion
Waffle charts offer a compelling and visually intuitive way to represent proportions and percentages, making them an excellent alternative to traditional pie charts or bar graphs - especially when communicating data to a broad audience. With R’s powerful visualization ecosystem, particularly the waffle package and its integration with ggplot2, creating these grid-based charts is both straightforward and highly customizable.
Throughout this article, we've explored the step-by-step process of building waffle charts in R - from installing the necessary packages and preparing your data, to customizing colors for maximum clarity and impact. Whether you're visualizing election results, demographic distributions, or progress toward a goal, waffle charts can help you tell a story that resonates.
If you like the work we do and would like to work with us, drop us an email on our contacts page and we’ll reach out!
Thank you for reading!