
Create Radar Chart with Tableau Viz Extensions
- Bernard Kilonzo

- Apr 10
- 2 min read

What is a Radar Chart?
A radar chart is a multivariate data visualization that displays three or more variables on axes that all start from a central point. The result is a polygon whose shape makes patterns, strengths, and gaps easy to compare at a glance. It’s also known as a spider chart, web chart, or star chart.
A radar chart arranges each variable on its own radial axis; all evenly spaced around a circle. Data values are plotted along each axis and then connected to form a closed shape. This makes it ideal for showing profiles, comparisons, and patterns across multiple dimensions.
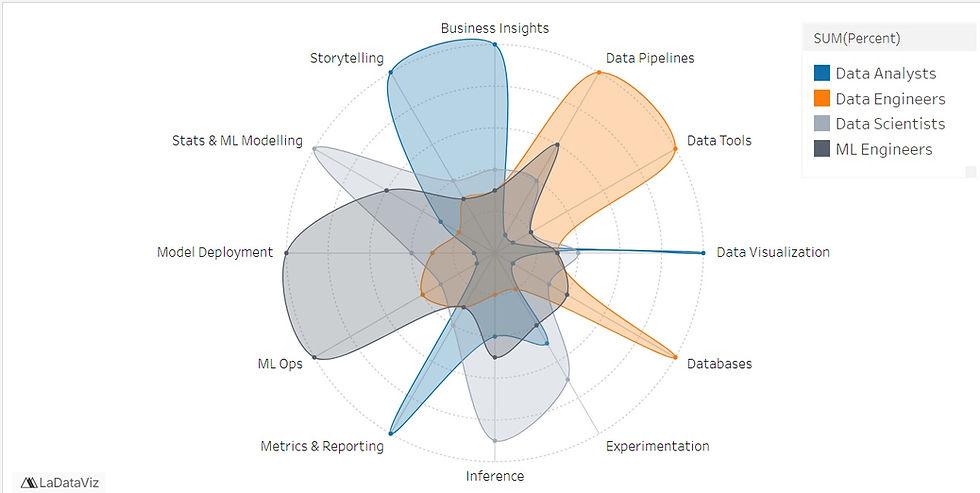
Example of a Radar Chart

Step-by-Step Guide
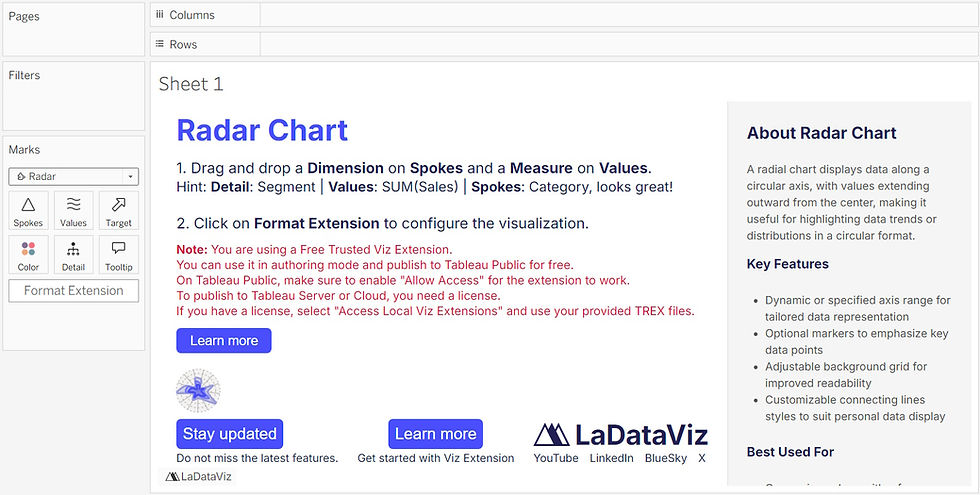
To create a Radar chart in Tableau. Add viz extension by going to the Marks card and select Add Extension.

On the pop-up window - go to the search bar and search “Radar”.

Select Radar by LaDataViz and open it.
Notice the changes on the marks card and the view.
Note you can purchase the extension to enjoy its full features and capabilities.
To create a Radar chart showing data roles.
Drag the measure Percent to the Values shelf.
Drag the dimension Skills to the Spokes shelf.
Drag the dimension Role to the Color shelf.
See the resulting view.

Formatting Radar Chart
Under Format Extension option you can.
Choose the appropriate color palette and make it visible.
Customize the orientation of labels.
Customize the gridlines.
To create the view below.
Conclusion
Creating a radar chart in Tableau with viz extensions opens up a level of flexibility and expressiveness that the native chart types simply can’t match. By combining Tableau’s powerful data model with the customization offered by extensions, you can build multidimensional visual profiles that are both intuitive and visually compelling.
More importantly, this approach empowers analysts to go beyond traditional dashboards and deliver richer, more comparative insights - whether profiling program performance, evaluating KPIs, or visualizing skill assessments. As the Tableau ecosystem continues to evolve, viz extensions offer a practical path to expanding your visual vocabulary without leaving the Tableau environment.
If you like the work we do and would like to work with us, drop us an email on our contacts page and we’ll reach out!
Thank you for reading!!