
Create a Tableau Story
- Bernard Kilonzo

- Jun 30, 2021
- 2 min read
Updated: Jan 6, 2025

A Tableau story is a sequence of visualizations that work together to convey information. Stories are a powerful way to tell a data narrative, provide context, demonstrate how decisions relate to outcome or simply making a compelling case.
Tableau story versus dashboard
A dashboard is simply a collection of views from worksheets (dashboards are made of worksheets). While a story contains a sequence of worksheets or dashboards or both that work together to convey certain information.
Tableau story example

How can I create a Tableau Story?
Once you’ve created your views (could be worksheets or dashboards or both). Go to the Story Tab.

(Note, in this case am creating a Tableau story using two dashboards i.e., Sales Metrics and Profit Metrics and a worksheet named Profitability).
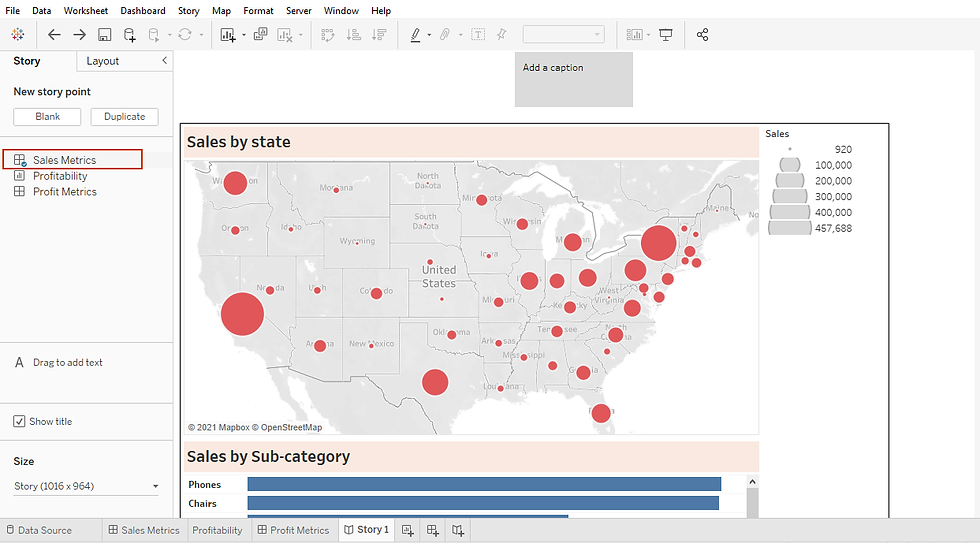
First drag the view (dashboard or worksheet) which will form the first tab of the story to the open view written ‘Drag a sheet here’.
In this case have added Sales Metrics dashboard.
Under the Story pane, add a blank story board by clicking ‘Blank’.

Now, drag the second view of the story board to the open view. In this case, I am going to drag the worksheet named ‘Profitability’.

Next, add the last dashboard to the story board. But instead of first introducing a blank board – simply drag it to the navigator bar at the top (another way of adding a view to the story board).

Executing this we’ve.

Next, give your storyboard a title by renaming the boards’ name.
You can also change the navigator styles under ‘Layout Pane’ to different options such as caption boxes, numbers, dots, or arrows.

To format the story board, go to Story menu and select >> Format to access options of formatting your story board.

I hope this was helpful to you. To receive more of the Tableau tips, kindly join our mailing list by subscribing below.
Thank you for reading.