
Computing Net Promoter Score (NPS) in Power BI


Overview
Customer‑experience teams rely heavily on survey data to understand how people feel about their interactions, and one of the most widely used indicators of loyalty is the Net Promoter Score (NPS). When analyzed properly, NPS becomes more than a single metric - it becomes a way to uncover patterns in satisfaction, spot emerging issues, and compare performance across products, regions, or customer groups. Turning raw ratings into a reliable NPS calculation requires thoughtful data categorization, and consistent logic so the resulting insights genuinely reflect customer sentiment. This article outlines the essential steps for computing NPS from survey responses and transforming it into a meaningful, decision‑ready metric.
So, what is Net Promoter Score (NPS)?
Net Promoter Score (NPS) is a customer‑experience metric that quantifies how strongly your customers are willing to recommend your product, service, or brand to others.
It is a standardized measure of customer loyalty based on how customers answer the question:
How likely are you to recommend our services to a friend or colleague? (Rated on a 0–10 scale)
Customers fall into three groups:
Promoters (9–10): Loyal enthusiasts who will recommend you and fuel growth.
Passives (7–8): Satisfied but unenthusiastic customers who may switch.
Detractors (0–6): Unhappy customers who can damage your brand through negative word‑of‑mouth.
NPS is then calculated by subtracting the percentage of detractors from the percentage of promoters. The score ranges from –100 to +100.
NPS = %Promoters - %Detractors (e.g., 60% - 40% = 20)
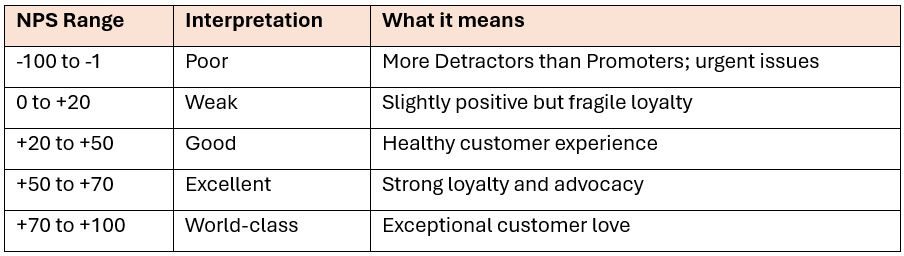
Interpreting NPS Value
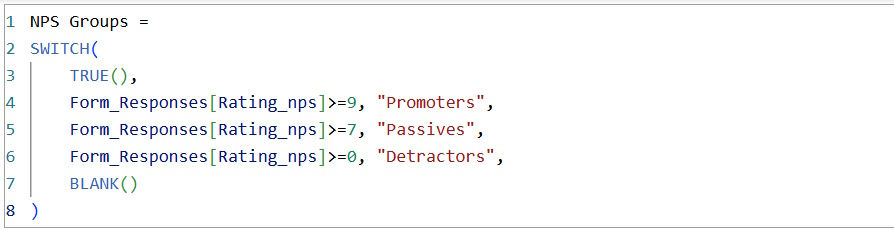
Computing NPS Groups
Using the rating question (Rating_nps) from your survey data, you can compute the NPS Groups in Power BI as follows.
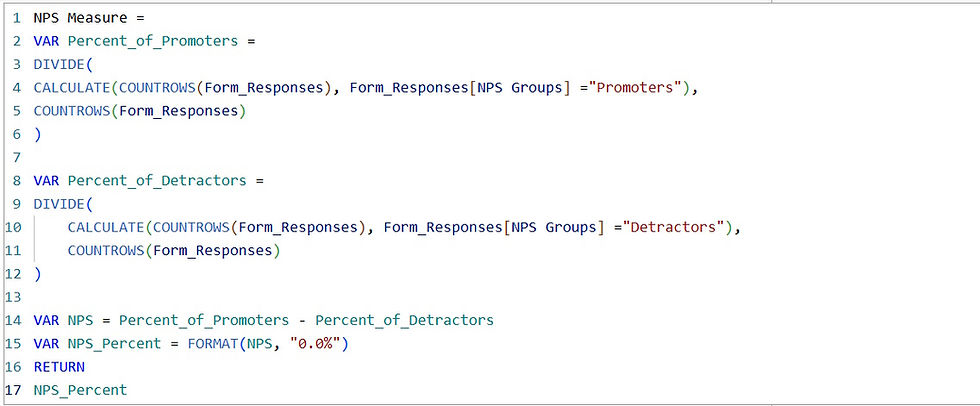
Computing Net Promoter Score (NPS) Value
Using NPS Groups calculation above, you can compute the NPS Value as shown below.
Build Executive Ready NPS-Visuals
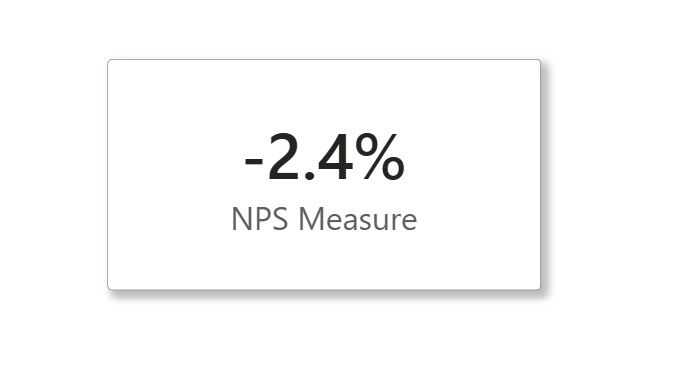
1. NPS Score Card
You can add NPS Measure to card to create a simple visual card showing the current NPS value.
2. Distribution of Promoters, Passives, and Detractors
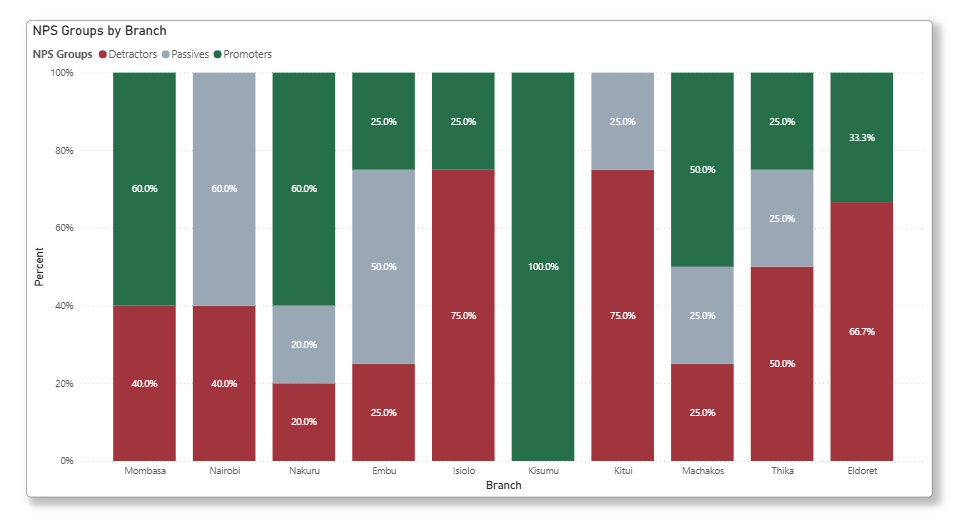
You can also use NPS Groups to compare performance across other groups such as branches as shown below.
Conclusion
Computing Net Promoter Score (NPS) in Power BI transforms a simple loyalty metric into a powerful, continuously evolving insight engine. By modelling the data correctly, categorizing responses with DAX, and building dynamic visuals, organizations can move beyond a single score and uncover the drivers behind customer sentiment. Power BI’s flexibility makes it easy to segment NPS by product, region, channel, or customer type - turning raw feedback into actionable intelligence. When combined with automated data collection and real‑time refresh capabilities, NPS becomes more than a retrospective measure; it becomes a strategic tool for improving experiences, reducing churn, and strengthening customer advocacy.
If you like the work we do and would like to work with us, drop us an email on our contacts page and we’ll reach out!
Thank you for reading!!