
Calculating Customer Satisfaction Score (CSAT) in Tableau
- Bernard Kilonzo

- Jun 20
- 2 min read

Overview
Customer experience teams rely on customer satisfaction score (CSAT) as one of their most immediate signals of how well they are meeting customer expectations. Because it captures reactions at the exact moment a service is delivered, CSAT becomes a practical, day‑to‑day operational tool - not just a quarterly KPI. Teams use it to spot friction points, validate improvements, and understand how customers feel about specific interactions such as support calls, branch visits, deliveries, or digital journeys.
In most organizations, CSAT acts as an early‑warning system. A sudden dip can reveal emerging issues long before they show up in complaints or churn metrics. Leaders use these patterns to prioritize fixes, allocate resources, and coach frontline teams. At the same time, consistently high scores help identify what’s working well - processes, agents, or touchpoints that can be replicated across the business.
When combined with qualitative feedback, CSAT becomes even more powerful. It helps teams connect the “what” (the score) with the “why” (the customer’s explanation), enabling more targeted improvements. Whether the goal is improving service quality, reducing customer effort, or strengthening loyalty, CSAT gives organizations a fast, reliable pulse on customer sentiment that guides continuous improvement across the customer journey.
What is Customer Satisfaction Score (CSAT)?
A customer satisfaction score (CSAT) is a metric that tells you what percentage of your customers report being satisfied with a product, service, or interaction. It’s typically gathered by asking a simple question such as “How satisfied were you with your experience?” and letting customers rate it on a scale – usually 1–5, 1–7, or 1–10 before being converted into a percentage that represents the share of “happy” customers.
CSAT (%) = (Number of positive responses ÷ Total responses) × 100
What counts as a “positive” response depends on the scale used:
1–5 scale: Ratings of 4 and 5 are considered satisfied.
1–10 scale: Ratings of 8–10 are considered satisfied.
1–7 scale: Ratings of 5–7 are considered satisfied.
Calculating CSAT in Tableau
Create a calculation computing the positive responses as shown below.
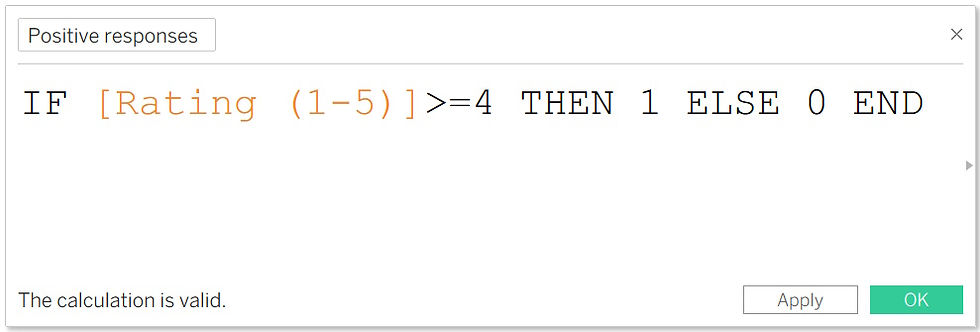
(This formula flags each satisfied response with a 1 and everything else with 0.)
Next, compute CSAT (%) as follows.

Build Visuals
1. CSAT Card
Create a simple KPI showing the current CSAT value.

2. Compare CSAT ratings by other groups
Show performance by other categories e.g., Branches for my case.

3. Compare CSAT ratings by Time
Show performance overtime.

Conclusion
A strong understanding of customer satisfaction score (CSAT) gives organizations a clear, actionable view of how customers feel at critical moments in their journey. While the calculation itself is simple, the real value comes from consistently measuring it, visualizing it effectively, and using those insights to guide improvements. Whether you're tracking service interactions, product experiences, or support performance, CSAT serves as a reliable pulse check on customer sentiment. By pairing accurate computation with thoughtful analysis, teams can move beyond reporting the score to actually elevating the customer experience.
If you like the work we do and would like to work with us, drop us an email on our contacts page and we’ll reach out!
Thank you for reading!!