
Action Filters in Power BI
- Bernard Kilonzo

- Dec 13, 2025
- 2 min read
Updated: Jan 17

Overview
Action filters refer to interactive filtering behaviors that occur when you click on a visual element. Instead of just highlighting related data, you can configure visuals so that clicking on one chart filters other visuals across the report, enabling drill-through, cross-report navigation, or dynamic exploration of data.
How to Set Up Action Filters
To demonstrate how to set up action filters in your Power BI dashboards, I have created the following demographic dashboard showcasing the demographic profiles for a survey data set.
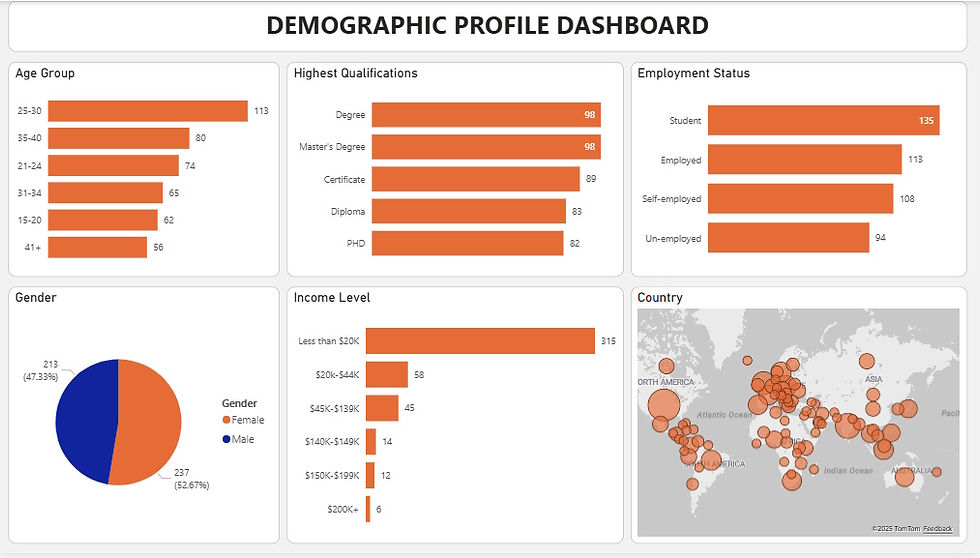
Notice, by default when you select or click on charts you highlight other visuals within the dashboard.
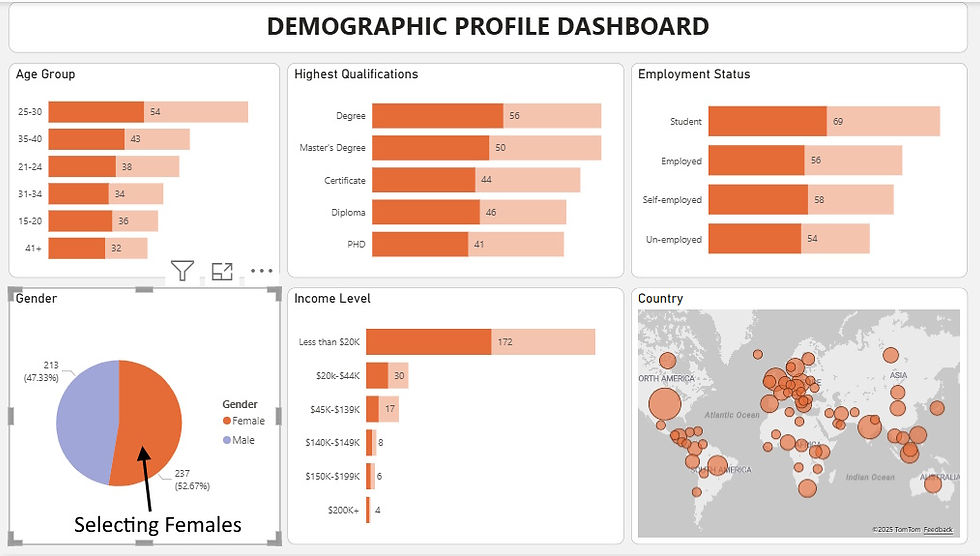
(In the above view, I have selected Female on the Pie chart – an action that has highlighted the Female respondents in other views)
Note you can customize the actions to trigger; filtering, highlighting, or doing nothing using the steps below.
Select the visual you want to control.
Go to the Format pane > Edit Interactions.
For each other visual on the page, choose:
Filter – which restricts the data to the selected value(s).
Highlight – which emphasizes related data but keeps all values visible.
None – which adds no interaction at all.
See the example below.

Therefore, in this dashboard, I am going to select each view (chart/graph) and apply a filter action in every other visual. That way when a user selects or clicks any chart only related information will be returned rather than using the default highlighting.
See the final dashboard below.
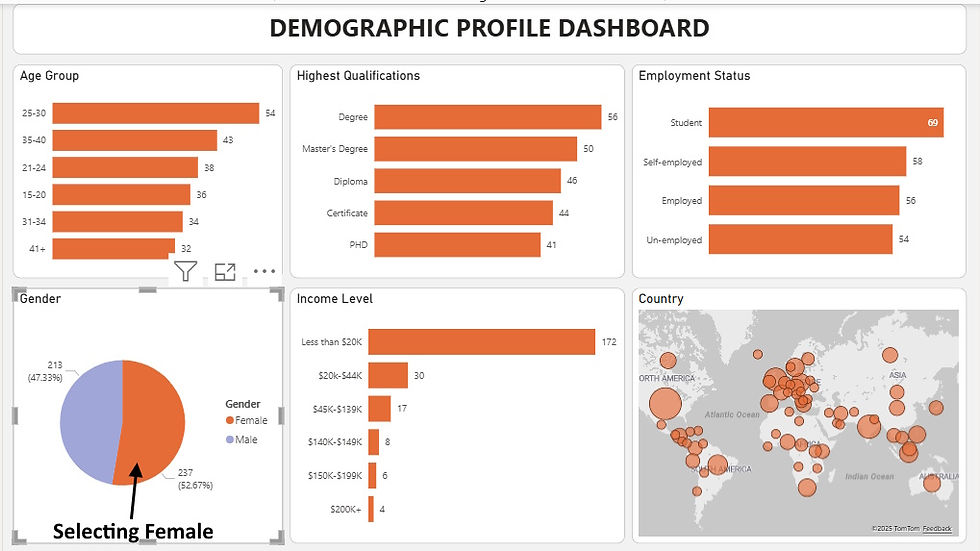
(Selecting Female in the Pie chart does not highlight the other views like in the previous setup – but instead it filters them out returning only data for the selected segment in this case Female respondents)
Conclusion
Action filters in Power BI are more than just a convenience - they are the backbone of interactive, user-driven analytics. By enabling visuals to filter, highlight, or remain independent, they empower report designers to craft dashboards that respond intuitively to user actions. Whether it’s drilling down into regional sales, navigating to detailed reports, or creating master-detail relationships, action filters transform static visuals into dynamic storytelling tools.
For organizations, this means faster insights, clearer decision-making, and dashboards that feel less like reports and more like guided experiences. For developers and educators, it’s an opportunity to showcase how a single click can reshape the analytical journey.
Ultimately, mastering action filters is about striking the right balance: knowing when to filter, when to highlight, and when to let visuals stand alone. Done well, they elevate Power BI from a reporting platform into a truly interactive decision-support system.
If you like the work we do and would like to work with us, drop us an email on our contacts page and we’ll reach out!
Thank you for reading!!