
4 ways you can compute the percent of total in Tableau
- Bernard Kilonzo

- Aug 28, 2021
- 2 min read
Updated: Jan 6, 2025

Percentages are ratio numbers – whereby the numerator is the value of a given mark while the denominator is the number to which you compare all your calculations, by default this number (the denominator) is based on the entire table in Tableau.
Therefore, in this class we’re going to learn four different ways you can compute percent of total.
But before that, lets build the table which we’re going to apply percent of total on - by.
Dragging Sub-category to the rows shelf and Sales to the text/label shelf.
See the resulting view.

1. Using Quick Table Calculation Option
The first way to add percent of total is by selecting ‘Percent of Total’ option under the quick table calculation.

Executing this results to.

Note, this could also be written as a calculated field as follows.

Adding this calculation to the view and formatting it, leads to the same results.

2. Using EXCLUDE LOD
We can also compute the percent of total by excluding the dimension ‘Sub-category’ while computing the denominator using the formula below.

Adding this calculation to the view and formatting it, leads to the same results.

3. Using FIXED LOD
We can also compute the percent of total using the FIXED LOD as follows.

Adding this calculation to the view and formatting it, leads to the same results as shown below.

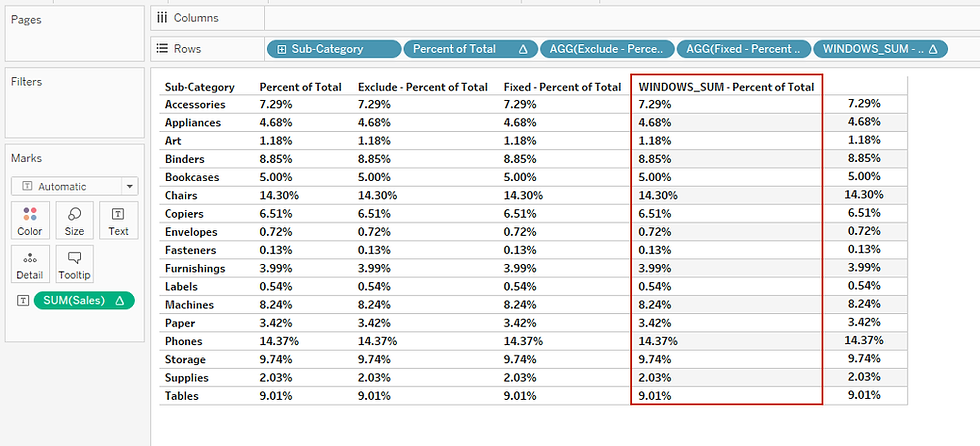
4. Using WINDOWS_SUM
We can also compute the percent of total using WINDOWS_SUM as follows.

Adding this calculation to the view and formatting it, leads to the same results as shown below.
I hope this article was helpful to you. To receive more of the Tableau tips, kindly join our mailing list by subscribing below.
Thank you for reading.