
Common Baseline - Tableau Table Calculations
- Bernard Kilonzo

- Feb 22, 2020
- 2 min read
Updated: Jan 3
This post will be helpful especially when you need to look at data from a common starting point rather than over an absolute timeline. A good example, is examining the sales growth for different products from launch date – by shifting the timeline to a common date part e.g. day, month, etc.
Using Superstores data set, I will be examining the Orders for different product Sub-category’s from the first order date. Visualizing the data on a common baseline – i.e. month(s) since the first order was made.
Let’s get the first order date for different Product Sub-categories.

Compute the number of month(s) to the subsequent orders from the first order.

Next create calculation INDEX() to shift this data to be relative to the first order month.

Drag the calculated field Index to the column shelf
Drag the dimension field ‘Order # Month’ to the details shelf
Drag dimension Sub-Category to the color shelf
Drag measure field Number of Records to the column shelf.
Chose line under marks cards

Add a running total to the SUM(Number of Records)

Edit the table calculation and compute using Specific Dimensions – 'Order # Month' for this case

Executing this we’ve.

Adding order number suffix to guide user in interpreting the chart.

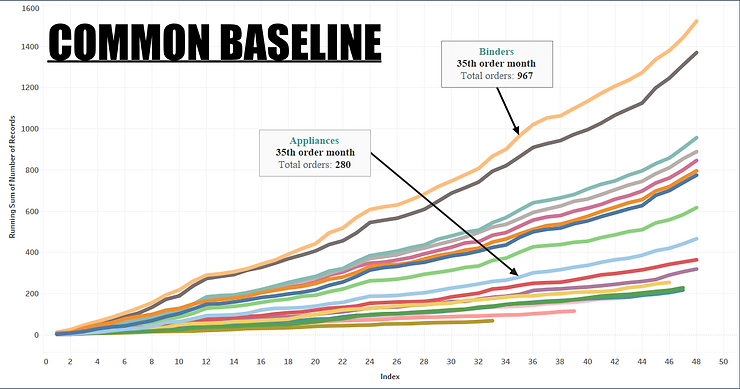
With this final view, you can easily tell which product sub-category recorded the highest growth in orders from the first order month.
Binders for instance recorded a total of 967 orders on the 35th order month while Appliances recorded 280 orders on the same period.
I hope this was helpful to you. To receive more of the Tableau tips and trick subscribe to the mailing list below.
Thanks for reading.