
Tableau tips: Set action - Color scaling
- Bernard Kilonzo

- Apr 7, 2019
- 2 min read
Updated: Apr 13

Set action is one of the new and powerful feature introduced in the Tableau 2018.3. It allows users to update or affect their analysis based on different interactions on a dashboard. A good example is when users can update the level of analysis of a worksheet by the act of selecting or hovering on a section of same or different worksheet.
So, what do I need to a create a set action?
To create and effect a set action, you need to specify the following in your viz;
The source sheet where the set is applied on.
User behavior that runs the action (hover, select or menu)
The data source and target set to be used
What happens when the selection is cleared
And most importantly, you MUST use the set referenced in the visualization, either as an active calculated field or by simply dropping it in the marks card.
The Problem
You might have noticed that when data has extremely high values (outliers), the existing difference between the non-extreme values can be lost when such data is visualized hence giving wrong indication and interpretation.
See the image below;
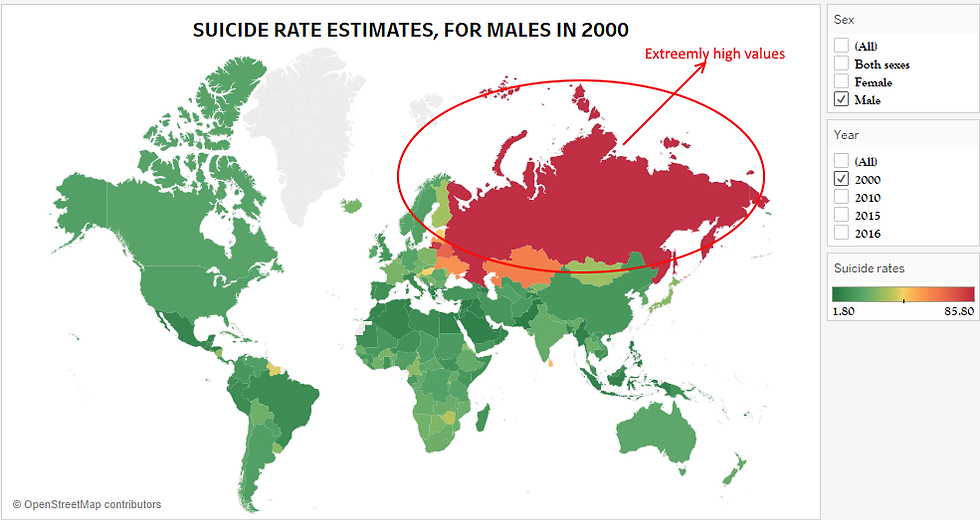
Because of high values in some of the Asian countries, the interpretation on other regions like Africa, North and South America can be lost.
What’s the solutions?
There are two ways around this;
Creating a custom color code using a simple calculated field - based on range of values.
Using set actions, which is more powerful and unlike the first option, is flexible.
(Using a set action, the viz interpretation-layout will always be updated to the current selection of the user)
Application of the set action
Am using data on suicide rate estimates by WHO. And in this case, I will be using the set in a calculated field.
Creating the set;

Using the set in a calculated field;

Creating the viz - Using the set in the viz
Drag dimension field 'Country' to the details shelf
Drag measure field ‘Computed metric’ to the color shelf.
(Note: For my case have added filters just to show the effect of outliers, hence should not worry you)
Now, adding a set action.
To do this;
Under worksheet menu, go to Actions…

Next

Executing above makes our set responsive, and now the viz can be updated based on user interaction - for this case, action runs on selecting.

I hope this was helpful to you. To receive more of the Tableau tips and tricks, kindly join our mailing list by subscribing below.
Thank you for reading.