Introduction to Tableau: Tableau screen sections
- Feb 13, 2018
- 2 min read
Updated: Dec 31, 2024

In the previous article, you learned how to connect to your data set and build the first chart in Tableau. In this article, I am going to introduce to you some of Tableau terms which will be used in many articles of this forum or elsewhere.
Note that the first page you land after connecting to any data in Tableau is called Data Source page shown below.

On the data source screen you can perform the following operations.
Manage your metadata by performing operations such as, hiding unnecessary columns, creating groups/calculated fields, changing data types among others.
Chose whether to work with live connection to the data or extract the data to Tableau in-memory data engine (hyper for those using 10.5+ edition).
Now, lets proceed to Sheet 1 and see some of important sections available there.

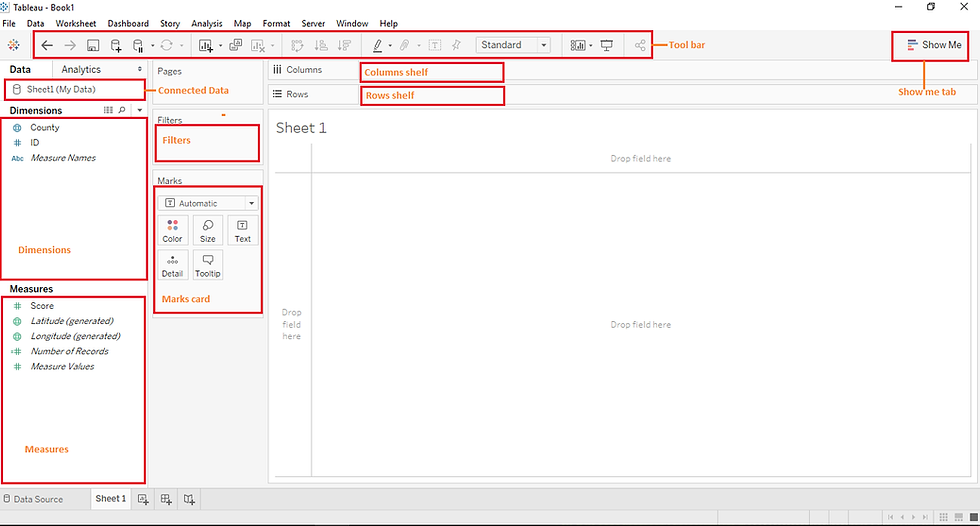
In the above screen, are the sections you will interact with in most of Tableau assignments. See their description below.
Toolbar - this section helps Tableau users access shortcuts to different actions like Saving,creating new sheets,sorting data,highlighting, changing presentation mode among others.
Dimensions - This section holds the discrete variables (in most cases) available in the data.
Measures - This section holds the continuous variables (in most cases) available in the data.
Filters - Filters help users pass the sub-set of data to be used in analysis.
Marks card - Marks card holds five tabs inside i.e Color, Size, Text, Detail & Tool tip. Depending on the kind of analysis, you may see another tab called Shape. This tabs help us format our charts and graphs.
Columns & Rows shelf - this act as our launching pad where we drag our dimensions and measures for visualization to be done.
Show Me tab - This section can be one of the useful part for new users, it helps users create simple charts and graphs by simply selecting the chart that suites the active fields (level of detail).
Other important sections are Dashboard tab and Story tab located at the bottom of screen next to Sheet 1. This two help users in compiling different sheets to create a data story.
I hope this article was useful to you.
Thanks for reading.
