
Tableau charts: Waterfall chart
- Bernard Kilonzo

- Feb 20, 2018
- 2 min read
Updated: Apr 13

What is a waterfall chart?
A waterfall chart is a form of visualization that helps in understanding the cumulative effect of sequentially introduced positive and negative values. A waterfall chart is also known as a flying bricks chart or Mario chart due to the apparent suspension of columns (bricks) in mid-air. In finance its often referred to as a bridge.
Example of a waterfall chart

Best practices for creating a waterfall chart
Use color to indicate the positive and negative flows.
Always label the chart clearly and appropriately
Provide additional details on the tooltips.
This chart is not limited to monetary values, it can also be used in other areas like human resources to illustrate the effects of hires, termination, and retirement on the headcount.
Step by steps on how to create a waterfall chart in Tableau.
I will be using Superstores data set pre-loaded in Tableau app, to create a waterfall chart using the dimension Sub-Category to show cumulative effect of Profit on the Sub-Category's.
But first, download the Superstores data set above and connect it with tableau app to follow along.
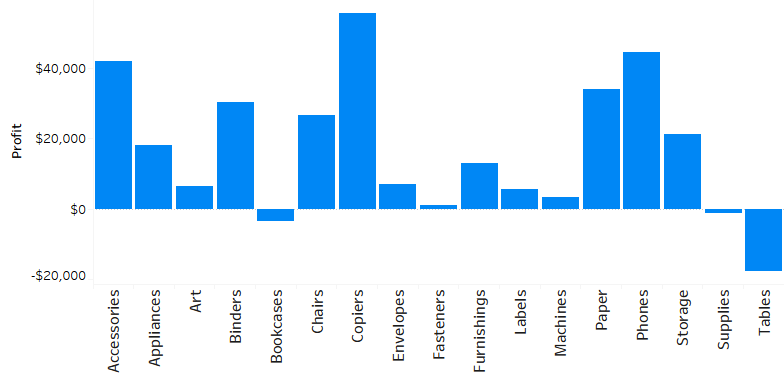
Create a simple Column chart using dimension Sub-Category and measure Profit.
Drag Sub-Category to the Column(s) shelf
Drag Profit to the Row(s) Shelf (Use SUM() as your aggregate function)
Under Marks Card, select chart type as a Bar.
See the resulting chart below.
2. Add a 'Quick Table calculation' to compute Running Total.
Right click on SUM(Profit) on the Row(s) shelf >>> Quick Table Calculation >>> Running Total (Note Table calculation is computed across Table, to confirm the same and correct if otherwise right click on SUM(Profit) >>> Compute Using >>> Table (across) ).

3. To show the cumulative effect of Profit on Sub-Category's, we need to define the Top and the Bottom from where suspended columns will begin. To achieve this we need to change the chart type from Bar chart to a Gantt Bar under Marks Card.
See the resulting chart below.

4. Add Column size.
Create a calculated field 'Column Size' below and drag it to the Size tab under Marks card to fill the gaps.

Adding above, Calculated field to Size tab results,

5. Now, we need to differentiate between Profitable and Unprofitable Sub-Category's within the suspended columns of the waterfall chart using the calculated field below,..
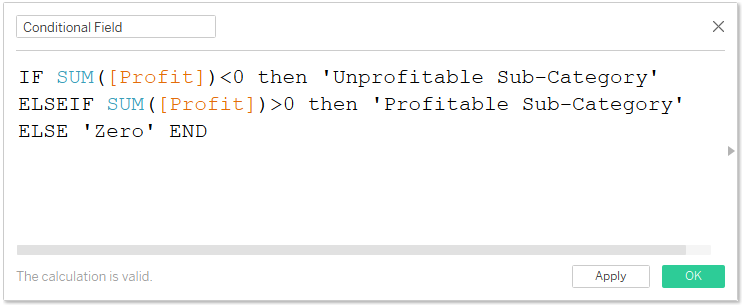
Adding the 'Conditional Field' above to the color tab we've.

6. We can go a notch higher by adding Grand Totals to show cumulative total for all Sub-Category's.
Go to Analysis Menu >> Totals >> Show Row Grand Totals. Executing this gives us our final chart below.

To receive more of these Tableau tips, kindly join our mailing list by subscribing below. Thank you for reading.